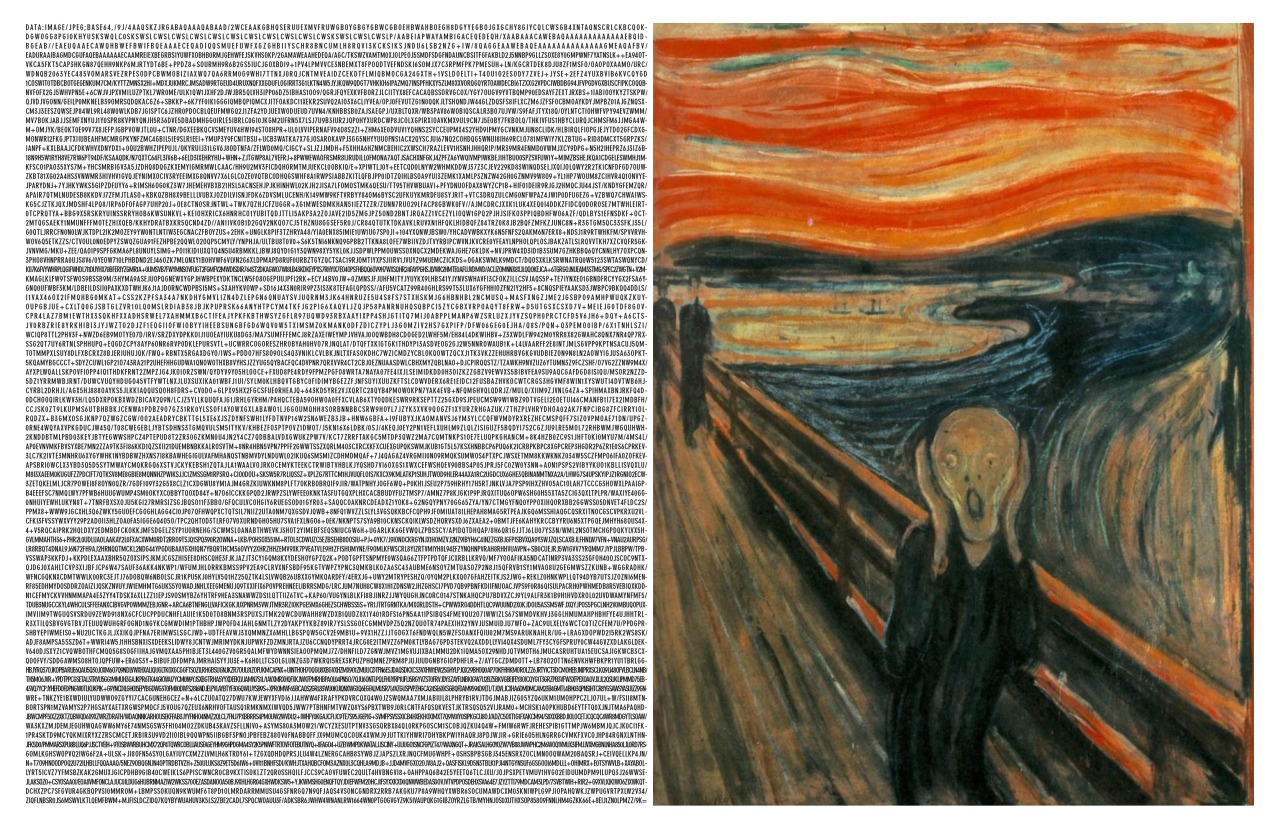
“The Scream” by Edvard Munch | click images to enlarge
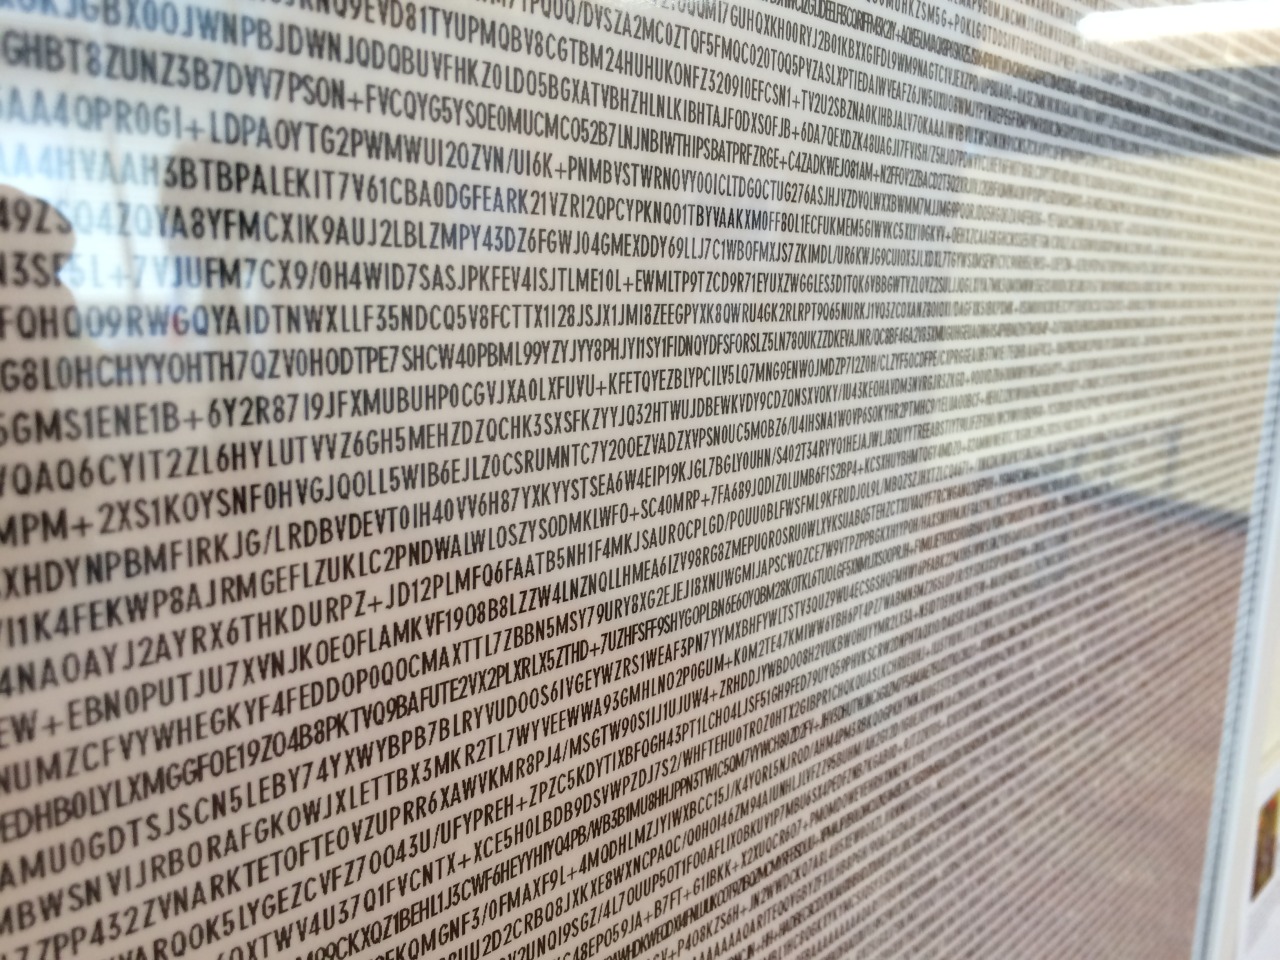
When Neo is resurrected with a newfound realization, he is able to see the Matrix for what it really is: a series of computer code made up of intricate strings of data. Similarly, the Internet, which we interact with now on a daily basis, is also made up of code that renders itself in a visual format for us to see and observe. But this fact is often overlooked, forgotten almost, which is what led to art director Yousuke Ozawa’s latest project: Data Visualization.
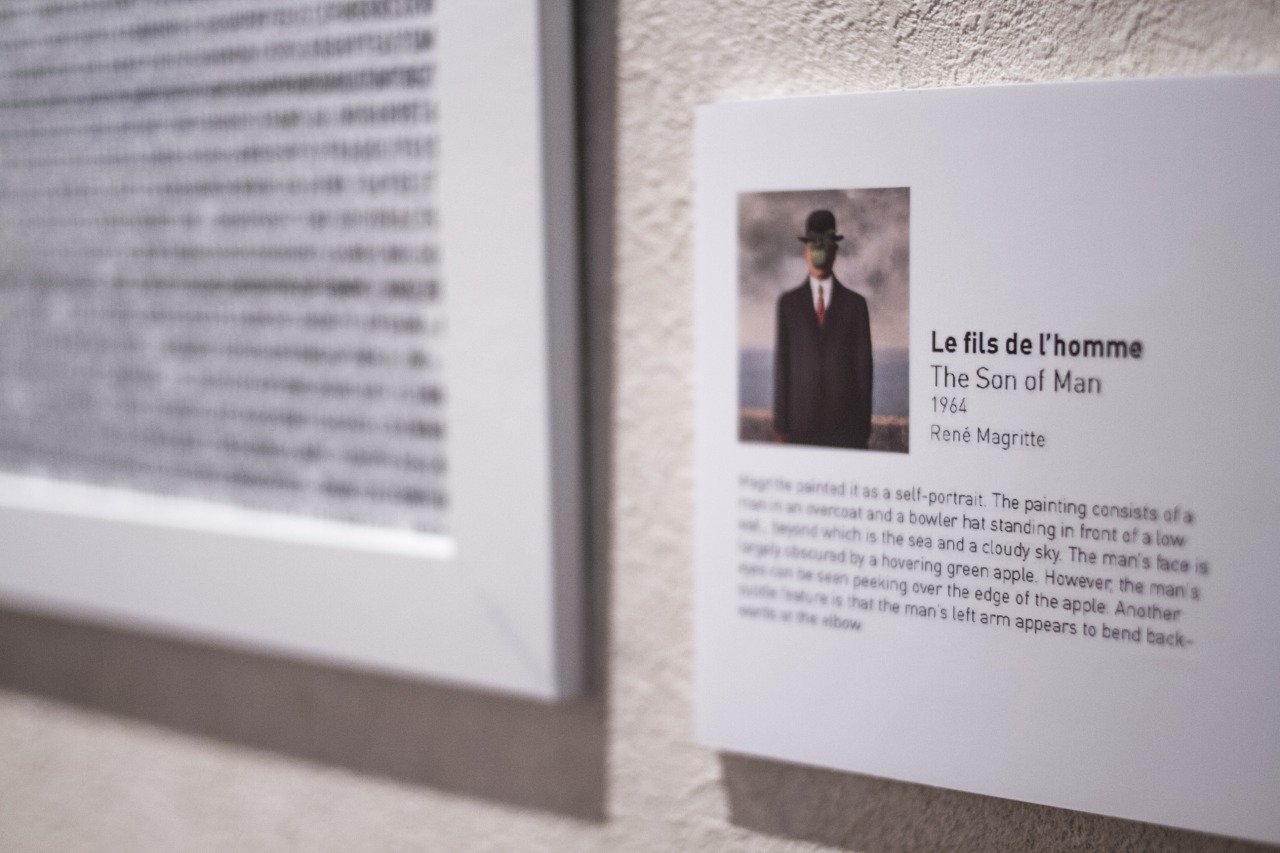
“Art is now seen through google images or wallpapers,” Ozawa tells us. “However, we are actually looking at a series of numbers and letters instead of actual paint.” Using a generator, Ozawa retrieves the codes of famous paintings and prints them out. He then aligns them side-by-side with a printed counterpart of the actual visual image.
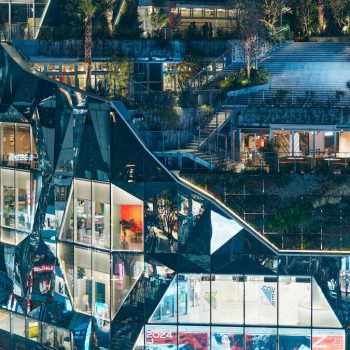
The Ogilvy & Mather Art Director is known for his creative use of the internet. In late 2014 he created Satellite Fonts, a typeface composed of buildings from Google Maps imagery.
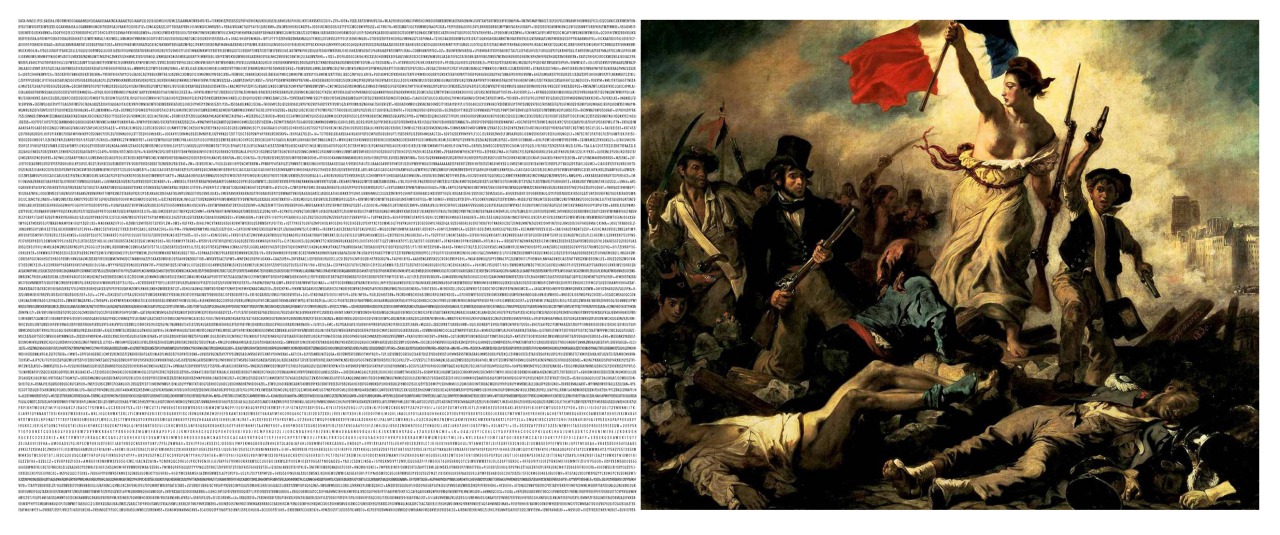
“Liberty Leading the People” by Eugène Delacroix
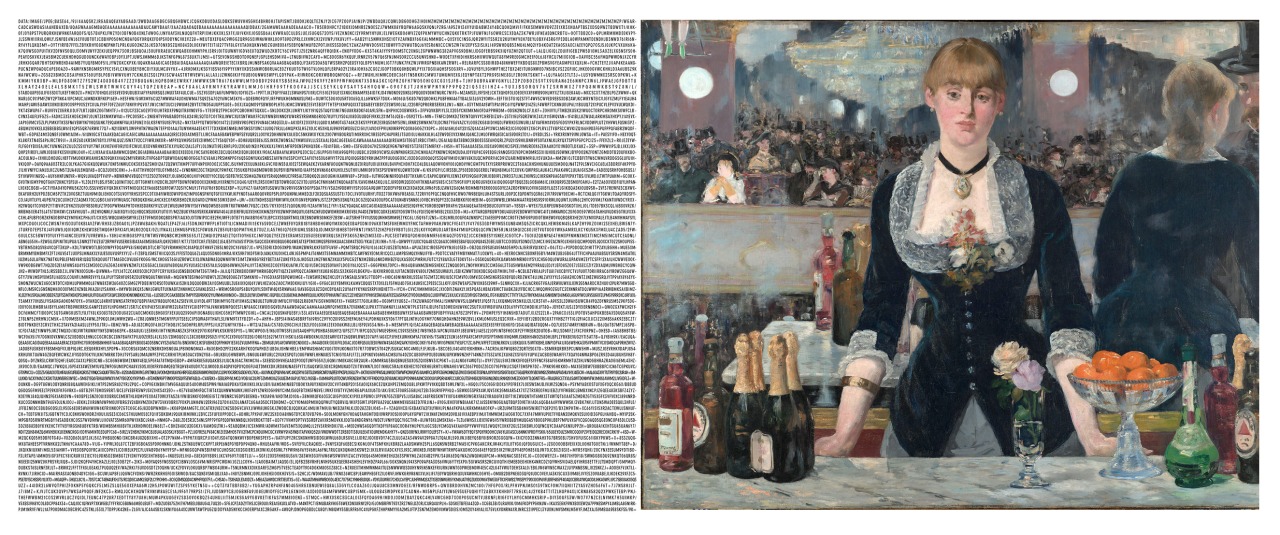
“A Bar at the Folies-Bergère” by Édouard Manet
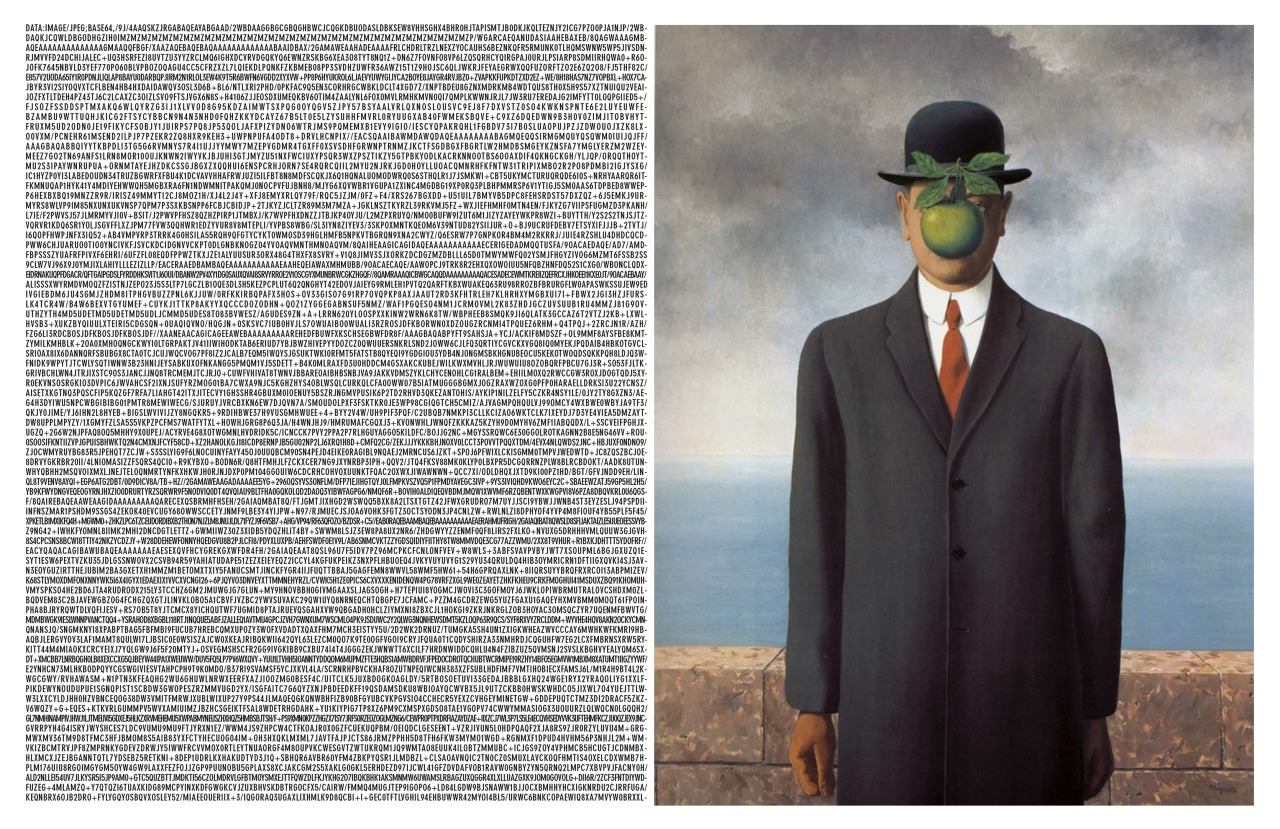
“The Son of Man” by René Magritte
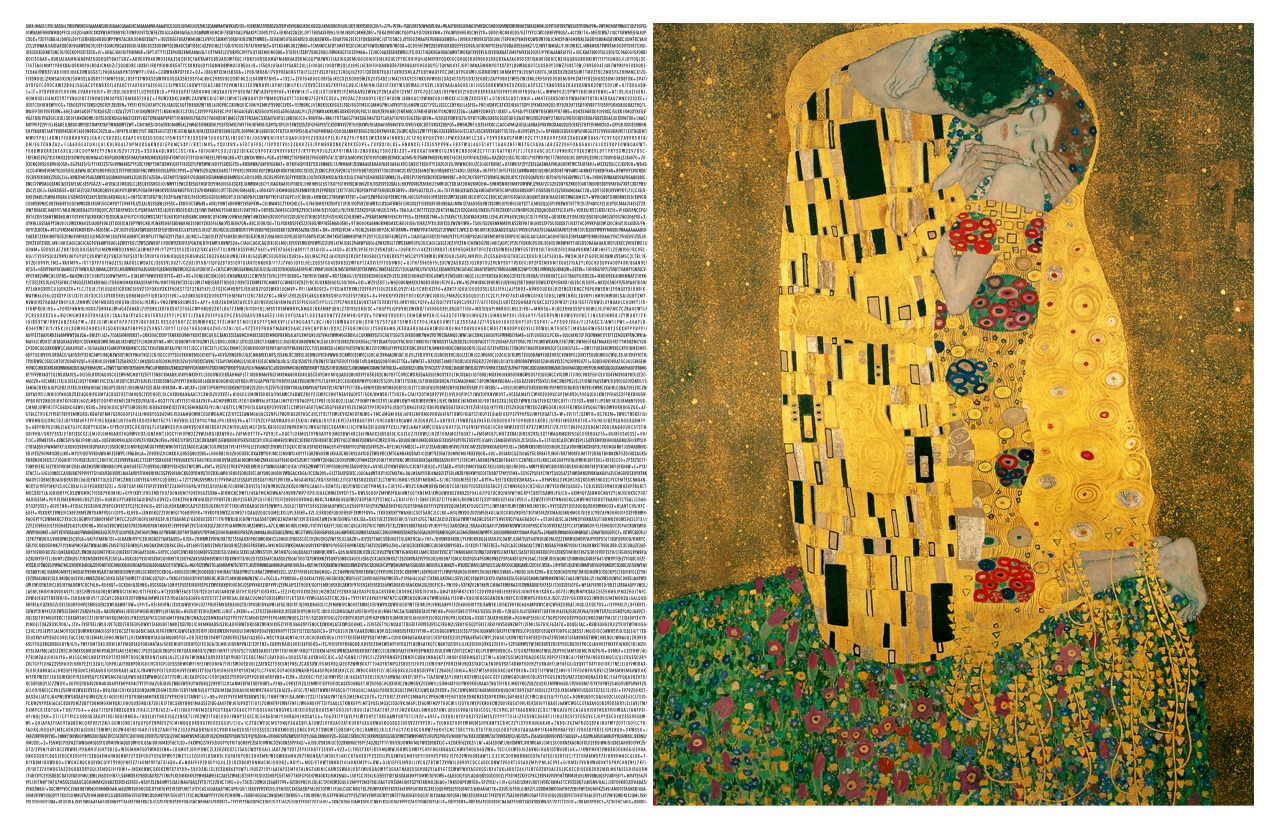
“The Kiss” by Gustav Klimt